3. Verify dataset statistically
You need to be a Pro member to access the full content of this.
Visual quality assessment evaluates the visual quality of the annotations, and statistical evaluation gives different insights via numbers.
I'll show you common things we should check. I hope you can take these as an example to apply to your own dataset (which probably have different properties than the example).
1. Show stats
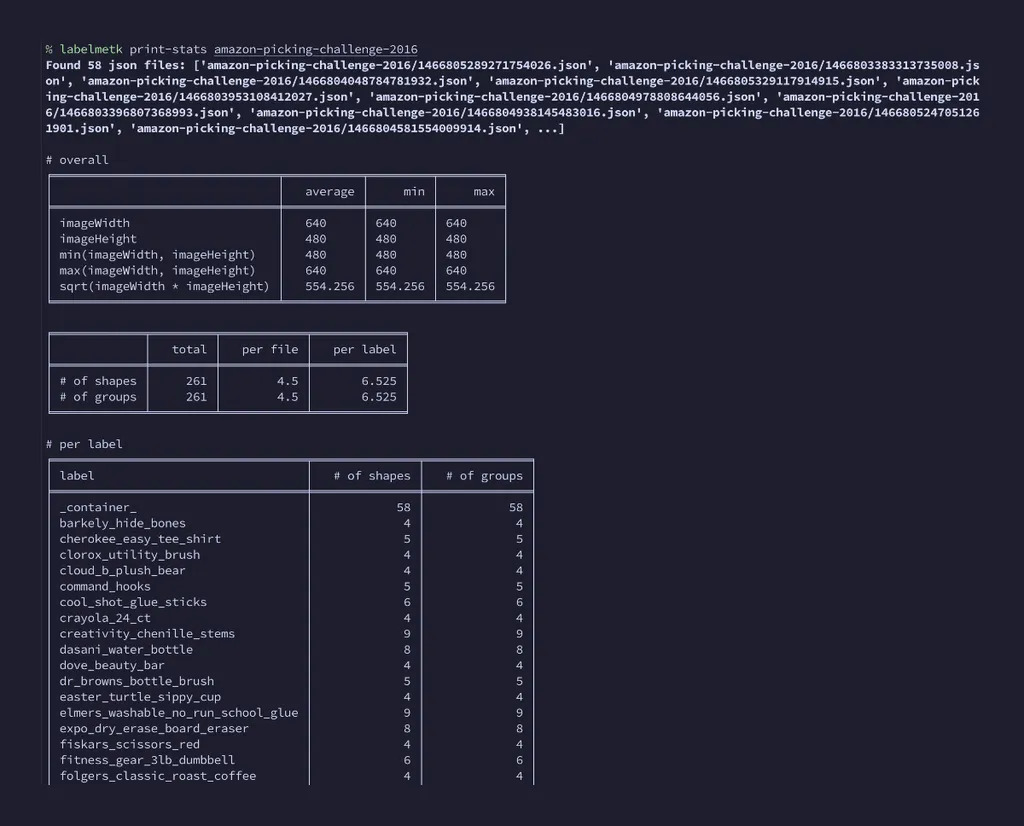
Let's use print-stats to show the statistics of the dataset:
labelmetk print-stats amazon-picking-challenge-2016
It should give output like below:
Let's go through each section in the following.
If you're a Pro member, sign in 🔒️ to read the rest of the guide. Or check our plans if you don't have them yet.